

India's Next Manufacturing Boom Has a Pattern We Have Seen Before
In December 1983, the first Maruti 800 rolled off a makeshift line in Gurgaon. India produced 20,000 cars that year. By 1994, a million had been built. By 2005, annual production hit 1.5 million. The auto sector barely registered on India's GDP in the 1980s. It grew to contribute 7% by the mid-2000s. Today it anchors a $120 billion ecosystem employing 37 million people.
What happened? A deliberate policy choice met a structural need. Post-1991 liberalisation, India needed to reduce import dependence, earn hard currency, and create mass employment. The auto sector was the instrument. Licensing was abolished. Tariffs dropped from 87% to 20%. Twelve global OEMs including Hyundai, Honda, Toyota, & Ford set up Indian operations within a decade.
The result was an entire ecosystem of ancillaries, tool rooms, and component manufacturers that became globally competitive.
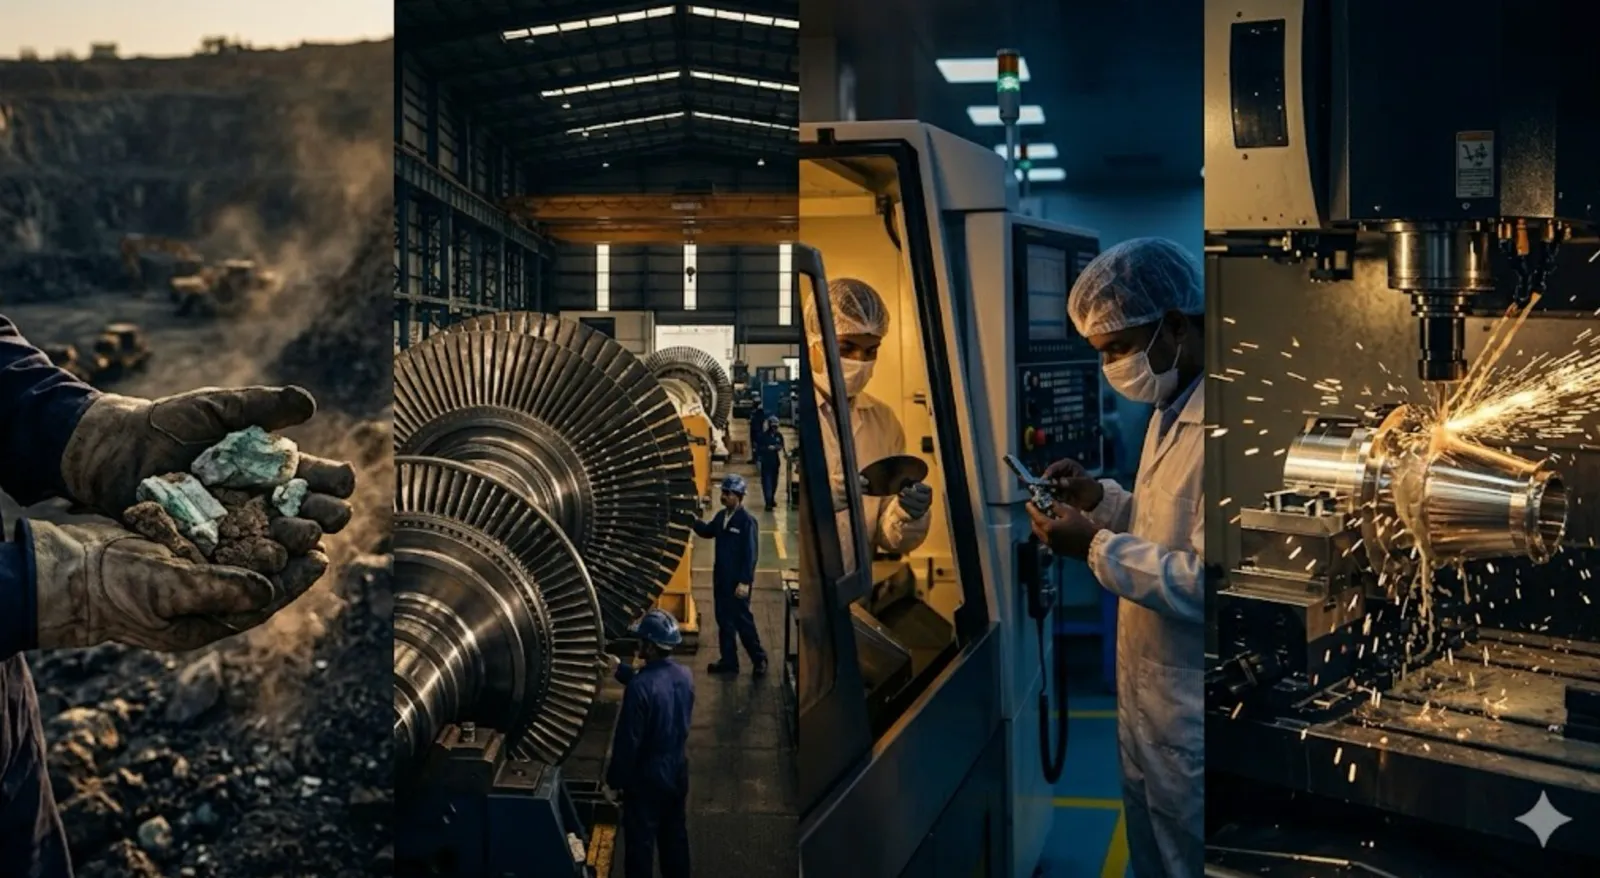
We are now at an eerily similar inflection. The sectors are different. The stakes are higher and the opportunity is broader. This article maps four sectors where that auto playbook is repeating — each at a different stage of the same S-curve:
- Precision Engineering
- Electronics Value Chain
- Power Equipment
- Critical Minerals
_11zon.webp)
1. Precision Engineering: From Components to Jet Engines
India cannot credibly aim for a $10 trillion economy while importing turbine blades for its commercial aircraft, rotors for its nuclear reactors, and precision components for its medical devices. Precision engineering — aerospace components, gas turbines, nuclear-grade parts, submarine propulsion systems — is where national security meets industrial capability.
The $80 billion global market grows at 15–20% CAGR. It is addressable because qualification cycles run 18–36 months, switching costs are enormous, and certifications create durable moats. Once qualified, a supplier is locked in for decades.
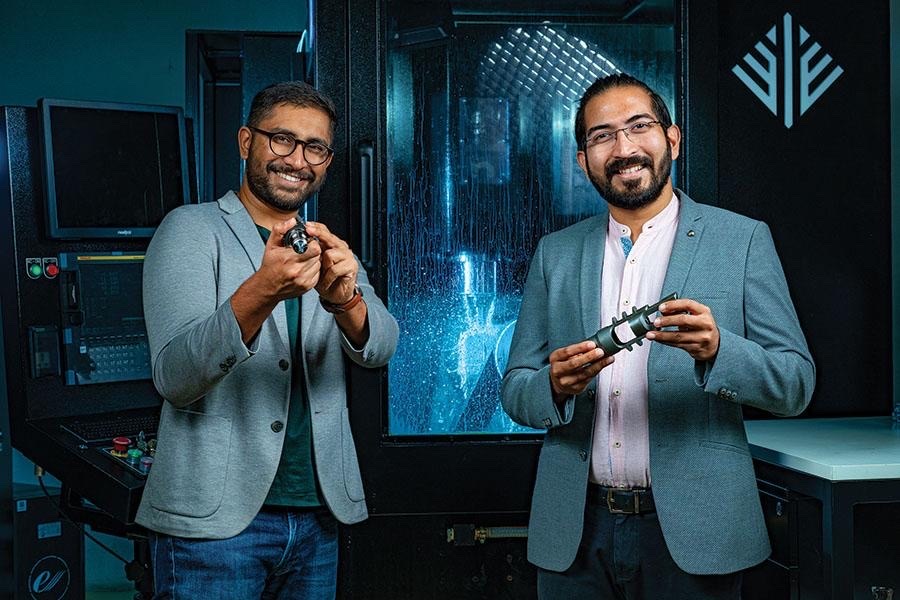
Consider Azad Engineering. Founded in 2008 with one employee and one CNC machine in 200 square metres. Today: 300 machines across 200,000 sqm. Clients include GE, Siemens, Honeywell, Safran, and Boeing. Gross margins exceed 85% on precision aerofoils that are mission- and life-critical. In 2026, DRDO awarded Azad the contract to manufacture India's first indigenous jet engine — the ATGG. This marks the transition from component supplier to systems integrator. The engine programme alone could scale Azad into a business larger than it is today.
Azad is 15–20% more cost-efficient than Chinese peers and 30–35% cheaper than European competitors (as cited in an ICICI Brokerage Report). This is not just labour arbitrage. It is process engineering that takes decades to replicate.
Medical devices tell a similar story. India imports over 80% of its medical devices — a $14 billion annual bill that is growing at 15%+ CAGR as healthcare spending scales. Precision implants, surgical instruments, and diagnostic equipment require the same tight-tolerance machining and cleanroom assembly as aerospace parts. Companies like Skanray, Trivitron, and Meril Life Sciences are moving up the value chain from assembly to design and IP ownership. The PLI for medical devices targets $8–10 billion in domestic production by 2030. The moat is identical: regulatory certification (FDA, CE marking) takes 2–4 years, and once a manufacturer is qualified, switching costs keep buyers locked in.
India has come far in precision engineering — from zero to globally qualified suppliers in under two decades. But the journey from component supplier to systems integrator is only beginning. The foundation is laid. Sustaining it will require deeper R&D, patient capital, and policy continuity measured in decades, not election cycles.
2. Electronics Value Chain: The Hardware Behind Every 'Smart' Thing
A car that carried $100 of electronics in the 1990s now embeds $3,000–$5,000 in chips, sensors, and control units. A ceiling fan has become a BLDC-motor-driven, app-controlled device. India recently tightened certification requirements on internet-connected CCTV cameras, squeezing Chinese brands like Hikvision and Dahua out of the market.
The logic is simple: if you don't control the hardware, you don't control the security.
Mobile phone manufacturing has jumped 146% under PLI — from $25 billion to $61 billion in four years. The real prize is deeper in the stack: PCB fabrication, semiconductor packaging, and passive components on the components side. The shift from contract assembly to ODM on the design
side. Non-consumer categories — telecom equipment, CCTV systems, industrial automation, medical devices — on the end-market side. The $250 billion+ electronics market grows at 20%+ CAGR.
India's position remains fragile without backward integration into components.
The concentration risk should keep every policymaker awake. Taiwan — a single island nation smaller than India's capital — controls 67% of global semiconductor foundry revenue and 90% of advanced chip fabrication below 7nm.
The world discovered this fragility during COVID. Auto plants in Detroit and Stuttgart stood idle because a foundry in Hsinchu couldn't keep up.
"The world's most critical supply chains run through single chokepoints. India probably sits on the wrong side of all of them and that is precisely where the opportunity lies."
It is largely apparent in the supply chain behind it: semiconductor fabrication, PCB manufacturing, passive components. India is already building that stack. The India Semiconductor Mission has committed ~$17 billion across 10 approved projects, with four ATMP/OSAT plants operational by 2026 and the first full-scale fab at Dholera targeted for 2028. ISM 2.0 expands the focus to semiconductor equipment, materials, and indigenous IP. The Electronics Component Manufacturing Scheme — oversubscribed and expanded to ₹40,000 crore — incentivises PCBs, connectors, and power electronics. Every smartphone assembled, every EV battery managed, every 5G base station deployed pulls demand deeper into domestically manufactured components. The country that builds the supply chain behind the EMS captures the durable margin.
3. Power Equipment: India's Grid Buildout Meets Global Demand
Global grid capex runs at roughly $400 billion a year and rising. The simultaneous build-out of renewables, data centres, and electrified transport is driving demand. India alone spends ₹4.5 lakh crore (~$54 billion) annually on energy infrastructure. 44% of that — roughly ₹2 lakh crore — still flows out to imports, foreign assembly, and offshore IP.
Across four megatrend segments reshaping the grid — AI infrastructure, renewable-plus-storage, smart grids, and high-speed rail electrification — each represents a $50 billion addressable market by 2030. Transformers, HVDC converters, and high-voltage switchgear are in structural shortage. Lead times for large power transformers have stretched from 50 weeks pre-COVID to 120–150 weeks. US and European utilities are actively qualifying new Asian suppliers outside China.
Indian incumbents have seen order books expand 2x–3x in 24 months. Export share is rising sharply. This is the same qualification-moat logic as aerospace: once a utility certifies a transformer OEM, switching costs run into years. Core inputs — electrical steel, copper winding, insulation systems — are being localised simultaneously under PLI for speciality steel and the Mission on Advanced & High-Impact Research.
The scale of what lies ahead is staggering. India's total installed power capacity needs to grow from ~500 GW in FY25 to ~1,100 GW by FY35 — a 2x+ increase. Data centres alone will consume 57 TWh by 2030, up from 12 TWh in 2024. Add transport electrification — 2.3 million EVs sold in 2025, three-wheeler EV penetration already at 54%.
India faces a power build-out that dwarfs anything it has attempted.
_11zon.webp)
The bottleneck is the transformer. 143 GW of solar under development, a railway and metro build-out, and INR 17 lakh crore (~$205 billion) of transmission spend since 2016 pushed 220 kV lead times from 8–9 months to ~14 months. The global AI buildout is piling on top. As Xponent Tribe laid out, a single 100 MW AI data centre needs 8–12 main transformers; with redundancy, operators order twice that. US prices are up nearly 4x since 2020. Bloomberg reported earlier this month that almost half of planned US data centres face delay because equipment simply cannot be sourced.
India produces just 50,000 tonnes of CRGO steel against domestic demand of 300,000–400,000 tonnes. Nearly half was historically filled by Chinese mills until BIS revoked their licences in 2024. India is scaling CRGO to 350,000 tonnes by FY28. Indian power-equipment makers are stepping into a market where buyers compete for slots, not negotiate on price. Every new generation of AI chip draws more power — which means more transformers per rack than the one before it.
“The next leg of sovereignty is digital, and digital runs on power. Data centres are the new factories; electricity is their raw material. Without backward integration into transformers, switchgear, and CRGO steel, India outsources the foundation of its AI economy the way it once outsourced oil. This is strategic necessity.”
4. Critical Minerals: The Geological Foundation
If precision engineering, electronics, and power equipment are the visible layers of this manufacturing stack, critical minerals are the geological base. The concentration risk here may be the most acute of all.
_11zon.webp)
China controls 91% of global rare earth processing, 98.7% of gallium production, and 60%+ of cobalt and lithium refining.
These are not abstract commodities. Rare earth permanent magnets go into every EV motor, wind turbine generator, guided missile, and precision sensor. Gallium is essential for 5G chips and LEDs. Lithium is the lifeblood of the battery economy. India imports 85–90% of its permanent magnets from China by quantity. Consumption is expected to double by 2030.
India's response has accelerated sharply. The National Critical Mineral Mission (₹34,300 crore, ~$4.1 billion, approved January 2025) was followed by the ₹7,280 crore (~$875 million) Rare Earth Permanent Magnet Manufacturing Scheme in November 2025, targeting 6,000 MTPA of integrated capacity from rare-earth oxides to finished magnets. The Union Budget 2026–27 announced Dedicated Rare Earth Corridors in Odisha, Kerala, Andhra Pradesh, and Tamil Nadu.
The resource base is substantial. The Geological Survey of India has identified 482.6 million tonnes of rare-earth ore resources. India holds 13.15 million tonnes of monazite containing an estimated 7.23 million tonnes of rare-earth oxides. The MMDR Act was amended in 2023 to open critical mineral exploration to private participation. Of 55 critical mineral blocks auctioned, 34 have been allocated to private players.
Internationally, India has joined the Minerals Security Partnership (MSP) and the Indo-Pacific Economic Framework (IPEF) for critical mineral supply chains. Bilateral agreements cover Australia, Argentina, Zambia, Mozambique, Peru, and five other mineral-rich nations. KABIL — a joint venture of NALCO, Hindustan Copper, and MECL — signed an agreement with CAMYEN in Argentina for five lithium brine blocks. This is the overseas acquisition playbook China executed for three decades. India is now running the same play.
Does it go far enough? The honest answer: not yet. The gap between geological discovery and commercial extraction is measured in decades, not quarters. India's critical mineral processing capability is near-zero today. China's 91% dominance was built over 30 years of sustained, subsidised investment in separation and refining.
The historical parallel is instructive. In the 1990s, India liberalised coal mining to meet power generation ambitions — opening captive blocks to private companies, restructuring Coal India, auctioning blocks commercially. It was messy and slow. But it worked. India went from chronic coal shortages to the world's second-largest producer. Critical minerals need a similar mobilisation. The clock ticks faster because the end-markets — EVs, batteries, semiconductors, defence systems — are scaling exponentially.
The Catalyst: Why These Sectors, Why Now
Most large economies followed a well-documented GDP evolution: agriculture to manufacturing to services. South Korea, China, Germany, Japan — each built a manufacturing base first, then layered services on top. India skipped the manufacturing step. It leapfrogged straight from agriculture to services in the 2000s, riding the IT boom while China became the factory of the world. The result: a services sector that today contributes 55% of GDP, but a manufacturing share stuck at 13–17% for two decades.
That missing leg now needs to be built. India's tech industry crossed $315 billion in revenue in FY26 per NASSCOM — still nearly 10% of GDP, still the most successful industry India has built post-reform. But AI and automation are structurally changing what that industry looks like. AI is already a $10–12 billion revenue line in Indian tech. The same AI is raising productivity per employee while reducing the need for incremental headcount. NITI Aayog's October 2025 report estimates 2.7 million roles in tech and customer services will be automated by 2031.
India has 10–12 million workforce entrants annually. A growing manufacturing base — in precision engineering, electronics, power equipment — can absorb that talent in higher-value roles that build on India's engineering strengths rather than competing with AI on routine services work.
The manufacturing engine also addresses India's structural current account deficit. IT-BPM services exports have been the single largest plug in the balance of payments for two decades. As AI raises the productivity bar in services, India needs a second engine earning dollars at scale. Precision engineering, electronics, power equipment, and critical-mineral processing are each addressable export markets measured in the hundreds of billions. The services-to-manufacturing rotation is not a retreat. It is the natural completion of India's economic evolution — filling in the missing chapter.
The 1990s Had One Tailwind. Today Has Four.
_11zon.webp)
In the early 1990s, India had a demographic dividend, pent-up domestic demand, and a newly permissive policy environment. That was enough to build a globally competitive auto sector in 15 years.
Today, India has all of that, plus three additional structural tailwinds. First, a geopolitical realignment — China+1 supply chain diversification is a multi-tri
India is the primary beneficiary. Second, a $23 billion PLI architecture that provides policy scaffolding for private investment at a scale the 1990s never had. Third, an energy transition that is simultaneously a manufacturing opportunity and an import substitution story.
India's manufacturing contribution to GDP has stubbornly hovered at 13–17% for two decades — versus 28% for China, 25% for South Korea, and 19% for Germany.
Closing this gap is the critical lever for the next leg of GDP growth as India moves from $4 trillion to $10 trillion.
Underpinning all three is critical minerals — the geological foundation without which none of the above scales. Every EV motor, wind turbine, transformer, guided missile, and 5G chip depends on materials where China controls 85–99% of global processing. Securing this feeder layer converts India's manufacturing ambition from aspiration to executable strategy.
Where Do These Sectors End Up? The Auto Trajectory as a Guide
The auto sector provides a useful yardstick. India's auto industry was a $3 billion affair in 1991. Fifteen years after the policy trigger, it had grown 10x to ~$30 billion. By 2025: $120 billion — a 40x expansion in 34 years!
The pattern is that an initial decade is spent on ecosystem formation, then an acceleration phase comes in driven by exports and domestic demand compounding.
- Using 2020 (PLI launch, China+1 acceleration) as the policy trigger: precision engineering at $5–8 billion today could reach $50–80 billion by 2035 on a 10x first-phase pattern.
- Electronics at ~$100 billion, with government targeting $500 billion by 2030, yields $300–500 billion on a 3–5x from here.
- Power equipment at ~$54 billion in Indian spend, scaling into global demand pull, reaches $150–200 billion on a 3–4x.
- Critical minerals: India’s processing capability today stands barely at $2 billion in mining and exploration. If India captures even a fraction of the global rare earth, lithium, and permanent magnet value chain, the sector could scale to $15–25 billion by 2035 — an 8–12x from a small base.
These numbers show just how policy scaffolding, structural demand, and geopolitical tailwinds align — exactly as they did for autos in the 1990s.
Each sector is earlier on the curve than auto was in 2005

The 1990s were India's first manufacturing inflection. We are now at the second — broader in scope, higher in IP intensity, and more urgent in timing. History does not repeat. But for anyone who watched the auto sector transform India's industrial landscape over two decades, the pattern is unmistakable. The time to build is, once again, now.
Sources & References
Auto sector production data (1983–2005): Society of Indian Automobile Manufacturers (SIAM), Annual Statistical Reports.
Auto sector GDP contribution and employment ('$120 billion ecosystem, 37 million jobs'): ACMA (Automotive Component Manufacturers Association of India), Annual Review 2024–25.
Post-1991 tariff reduction (87% to 20%) and OEM entry: Reserve Bank of India, Report on Currency and Finance 2003; DPIIT FDI factsheets.
Precision engineering global market size ($80 billion, 15–20% CAGR): Goldman Sachs, India Defence Conclave 2025 investor notes.
Azad Engineering operational data (300 machines, 200,000 sqm, 85%+ gross margins, OEM clients): Company annual report FY25; Goldman Sachs plant visit notes, Mar 2025.
ATGG jet engine programme (DRDO contract, 500–1,000 units/annum, unit costs): Press Information Bureau, DRDO press release, Feb 2026.
Azad cost advantage vs China (15–20%) and Europe (30–35%): Goldman Sachs Defence Conclave notes, company investor presentations.
Nuclear Energy Mission (100 GW by 2047, current 9 GW, 8,000 MW under construction): DAE (Department of Atomic Energy), Annual Report 2025–26.
SHANTI Act 2025 (private sector participation, INR 19 trillion capex): ICICI Securities, Capital Goods & Utilities Thematic Update, Mar 2026.
Mobile phone manufacturing growth (146% under PLI, $25 billion to $61 billion): ICEA (India Cellular and Electronics Association), Annual Report 2025.
Electronics market size ($250 billion+, 20%+ CAGR): MeitY (Ministry of Electronics & IT), National Policy on Electronics 2024 review.
PLI scheme scale ($23 billion across electronics): MeitY PLI dashboard; Union Budget 2024–25 expenditure statements.
Taiwan semiconductor share (67% foundry revenue, 90% advanced fab <7nm): Semiconductor Industry Association (SIA), 2024 Factbook; BCG–SIA joint report.
CCTV certification tightening (Hikvision/Dahua impact): MeitY notification on Compulsory Registration Order for CCTV cameras, 2025.
China rare earth processing (91%), gallium (98.7%), cobalt/lithium (60%+): USGS Mineral Commodity Summaries 2025; IEA Critical Minerals Report 2024.
India permanent magnet imports (85–90% from China, doubling by 2030): PIB, REPM scheme announcement, Nov 2025.
Global grid capex (~$400 billion/year): IEA World Energy Investment 2025.
India energy infrastructure spend (₹4.5 lakh crore annually, 44% foreign dependency, $50B per megatrend segment by 2030): Enerzolve Smart Technologies, Series A investor presentation, 2026.
Transformer lead times (50 weeks pre-COVID to 120–150 weeks): Bloomberg, 'US Data Centres Face Transformer Bottleneck,' April 2026; Xponent Tribe Q2 FY26 update.
Order book expansion (2–3x in 24 months): Company filings — CG Power, Apar Industries, Transformers & Rectifiers (BSE/NSE quarterly results FY25–26).
CRGO steel production (50,000 tonnes vs 300,000–400,000 demand, scaling to 350,000 by FY28): IEEFA India, 'India's CRGO Deficit,' 2025; JSW Steel and JSPL capacity announcements.
BIS licence revocation for Chinese CRGO mills (2024): Bureau of Indian Standards public notices.
AI data centre transformer demand (8–12 main transformers per 100 MW): Xponent Tribe, Q2 FY26 sector update.
Power capacity roadmap (~500 GW FY25 to ~1,100 GW FY35): CEA, National Generation Adequacy Plan (2026–27 to 2035–36), Midterm Review of the 20th Electric Power Survey, March 2026.
Peak electricity demand (700 GW by 2047): CEA, 20th Electric Power Survey of India.
Data centre power demand (12 TWh in 2024 to 57 TWh by 2030): CRISIL Infrastructure Advisory; JLL India Data Centre Report 2025.
EV market (2.3 million units in 2025, 54% 3W penetration): Vahan Dashboard (Ministry of Road Transport); SMEV (Society of Manufacturers of Electric Vehicles) FY25 data.
Grid unification history (PGCIL 1989, regional links, national grid 2013): PGCIL (Power Grid Corporation of India), corporate history; CEA grid interconnection reports.
Transmission investment ($15+ billion since formation): PGCIL annual reports; MoP (Ministry of Power) investment data.
National Critical Mineral Mission (₹34,300 crore, Jan 2025): PIB, Cabinet approval press release, Jan 2025.
REPM scheme (₹7,280 crore, 6,000 MTPA target, Nov 2025): PIB, MoMME press release, Nov 2025.
Rare Earth Corridors (Odisha, Kerala, AP, Tamil Nadu): Union Budget 2026–27 speech, Ministry of Finance.
Ore resources (482.6 million tonnes), monazite (13.15 million tonnes), REO (7.23 million tonnes): Geological Survey of India, Indian Minerals Yearbook 2024.
MMDR Act amendment (2023, 55 blocks auctioned, 34 allocated): Ministry of Mines, annual review 2024–25.
KABIL–CAMYEN Argentina lithium agreement: KABIL press release; PIB, Ministry of Mines, 2025.
Minerals Security Partnership (MSP), IPEF membership: Ministry of External Affairs, India's participation briefs.
IT industry revenue ($315 billion FY26): NASSCOM Strategic Review, February 2026.
India GDP evolution (services 55%, manufacturing 13–17%): World Bank, World Development Indicators 2024.
AI as $10–12 billion revenue line: NASSCOM AI sector analysis, 2026.
AI workforce impact (2.7 million roles by 2031): NITI Aayog, 'AI and the Future of Work in India,' October 2025.
Manufacturing share of GDP (India 13–17%, China 28%, South Korea 25%, Germany 19%): World Bank, World Development Indicators 2024.
PLI architecture ($23 billion total): DPIIT, PLI scheme consolidated dashboard, March 2026.
Auto sector trajectory ($3B in 1991, $30B by 2005, $120B by 2025): SIAM; ACMA Annual Review; author's calculations.
Electronics $500B target by 2030: MeitY, National Policy on Electronics 2024.
Market size extrapolation methodology: author's estimates applying auto-sector growth curve to current sector baselines.


.webp)

.webp)
.webp)
.webp)


_page-0001%20(1).webp)

.webp)

